
Prompt Library
AI Prompt Library
Curated image, video and web design prompts from creators around the world. Copy any prompt, swap the subject or style, and generate with the latest models.
15,630 prompts · Updated daily · 100% free
606 prompts
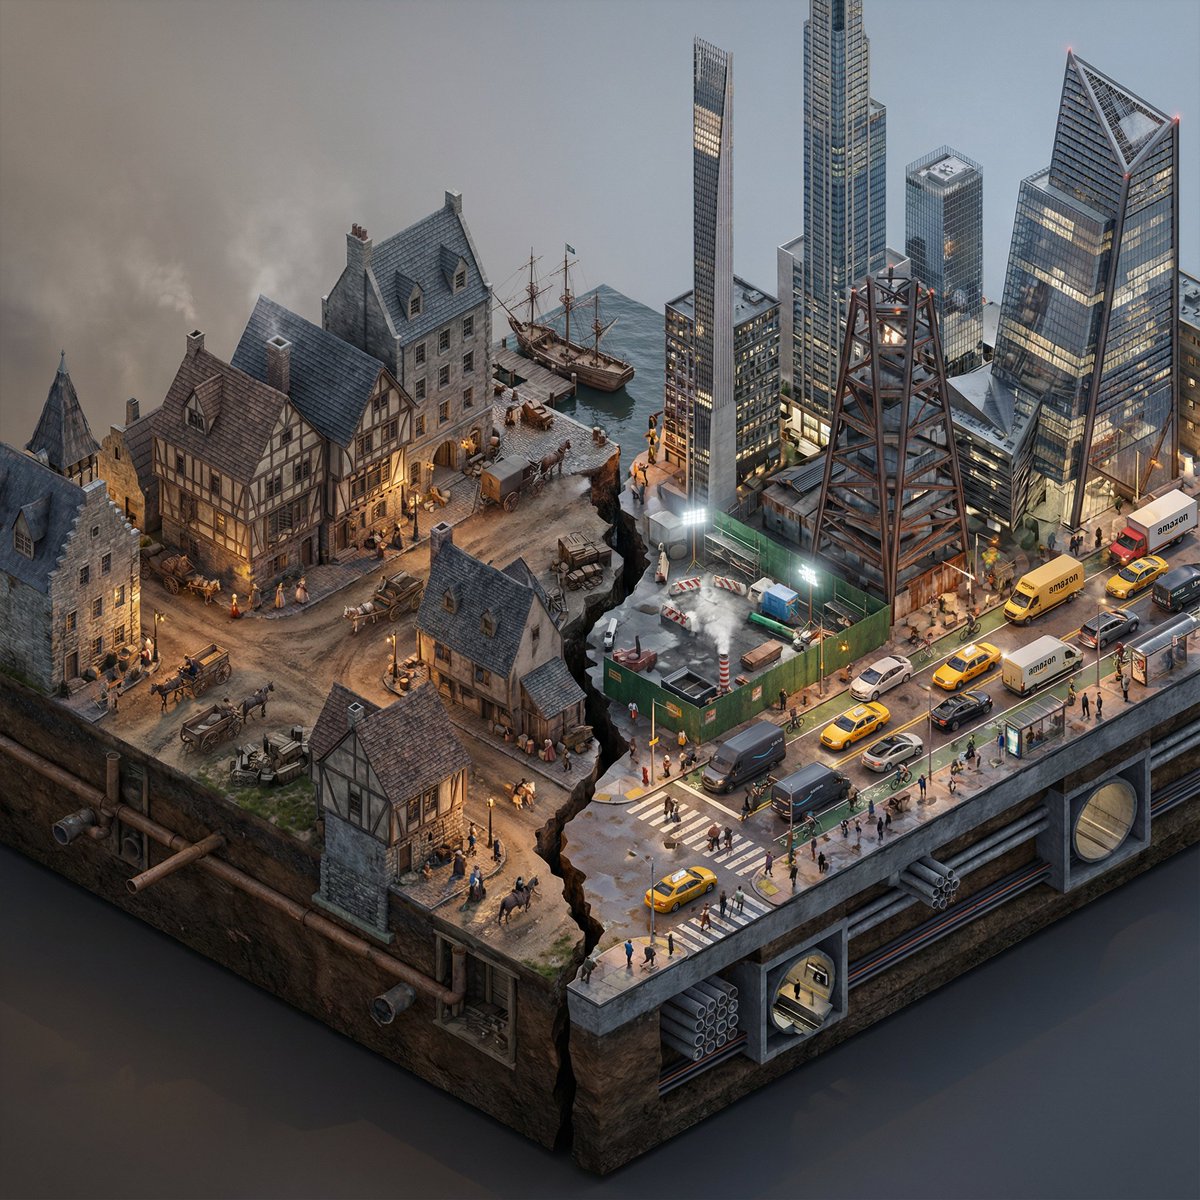
Split-Era Urban Diorama Generation Prompt for Nano Banana Pro
Do this for {argument name="City/Year A vs. City/Year B" default="New York 1700 vs New York 2025"} <instructions> Input Variable: [City/Year A vs. City/Year B] (e.g., New York 1900 vs. New York 2025) System Instruction: Generate a photorealistic, isometric macro render of a split-era urban diorama. The goal is Historical and Municipal Accuracy, avoiding sci-fi tropes or idealization. 1. Temporal Forensic Analysis: Analyze the Dates: Strictly adhere to the architectural technologies available in Year A versus Year B. The Left Block (The Past): Construct the Left side using the dominant vernacular of the era. For 1900: Beaux-Arts stone, brick tenements, water towers, external fire escapes, and cobblestone/early asphalt. The Right Block (The Present/Future): Construct the Right side using current urban realities, not futuristic fantasies. For 2025: Prioritize "Super-Slender" Pencil Towers (Billionaire's Row style), Glass Curtain Walls mixed with preserved older facades, and "Hudson Yards" style angled steel. Crucial Detail: If the year is modern (2020+), you MUST include Urban Clutter: Green construction plywood barriers, sidewalk scaffolding (sheds), steam vents, and delivery trucks. 2. The Container (The Cross-Section): The Base: Two suspended chunks of city infrastructure, revealing the "Underground" layer on the side profile. Left Underground: Brick sewers and early subway tunnels. Right Underground: Concrete conduit banks, fiber optic lines, and modern subway tiles. The Divider: A jagged timeline fracture. No glowing sci-fi energy. The divide is a stark cut in the asphalt. 3. The Composition (The Density): Left Street Life: Period-accurate transport (Horse-drawn carriages mixed with early Model T Fords or Trolleys). Pedestrians in dark coats/hats. Right Street Life: Municipal Realism. Yellow Taxis, Amazon delivery vans, Uber cars, and bike lanes with cyclists. The street level should feel congested and chaotic. Vegetation: Left has Elm trees (if applicable); Right has manicured "Corporate Plaza" planters and rooftop gardens. 4. Accurate Lighting Simulation (No "Neon Filters"): Left Lighting: Carbon-Arc and Gaslight. The light should be dim, patchy, and warm (2400K), casting long shadows. Right Lighting: Mixed Municipal Lighting. A chaotic mix of warm sodium streetlights (orange), harsh white LED construction lights (6000K), and internal office lighting (neutral). Do not use "Cyberpunk Blue" or "Purple" unless it is a specific billboard. Atmosphere: The Left is hazy from coal smoke. The Right has a clearer, sharper air quality but with light pollution. 5. Visual Syntax: Camera: Isometric Orthographic projection, 45-degree angle. Render Style: Photorealistic Architectural Visualization (ArchViz), 8k, V-Ray Render. Focus on texture fidelity (rust, wet pavement, grime) rather than bloom effects. Output: 1:1 Aspect Ratio, Extreme Detail, Historically Authentic.
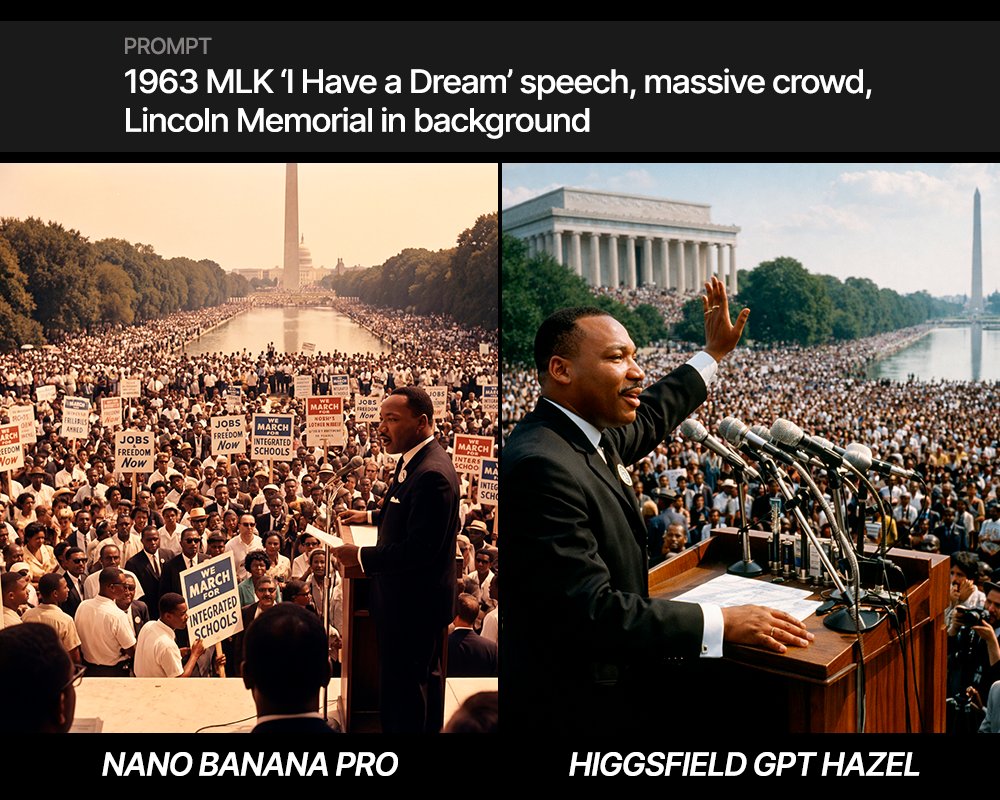
MLK 'I Have a Dream' Speech Scene Prompt
"1963 MLK ‘I Have a Dream’ speech, massive crowd, Lincoln Memorial in background"
Nano Banana Pro Prompting Strategy for Stable Output
① Always switch the mode to 'Thought' or 'Pro' (I feel 'Thought' is better) ② 'Describe the scene in sentences' rather than listing keywords ③ Specify the subject, background, and atmosphere as a set of three points ④ Don't aim for perfection in one go; apply 'gradual corrections' ⑤ Avoid negative expressions; give instructions in positive sentences ⑥ Add quality keywords (4K, high resolution) in English ⑦ Clearly state the purpose at the beginning (e.g., "{argument name="purpose" default="Diagram for a proposal"}") ⑧ Exclude unnecessary elements using negative prompts ⑨ Do not attempt complex edits all at once; proceed in segments ⑩ Save frequently used prompts as templates
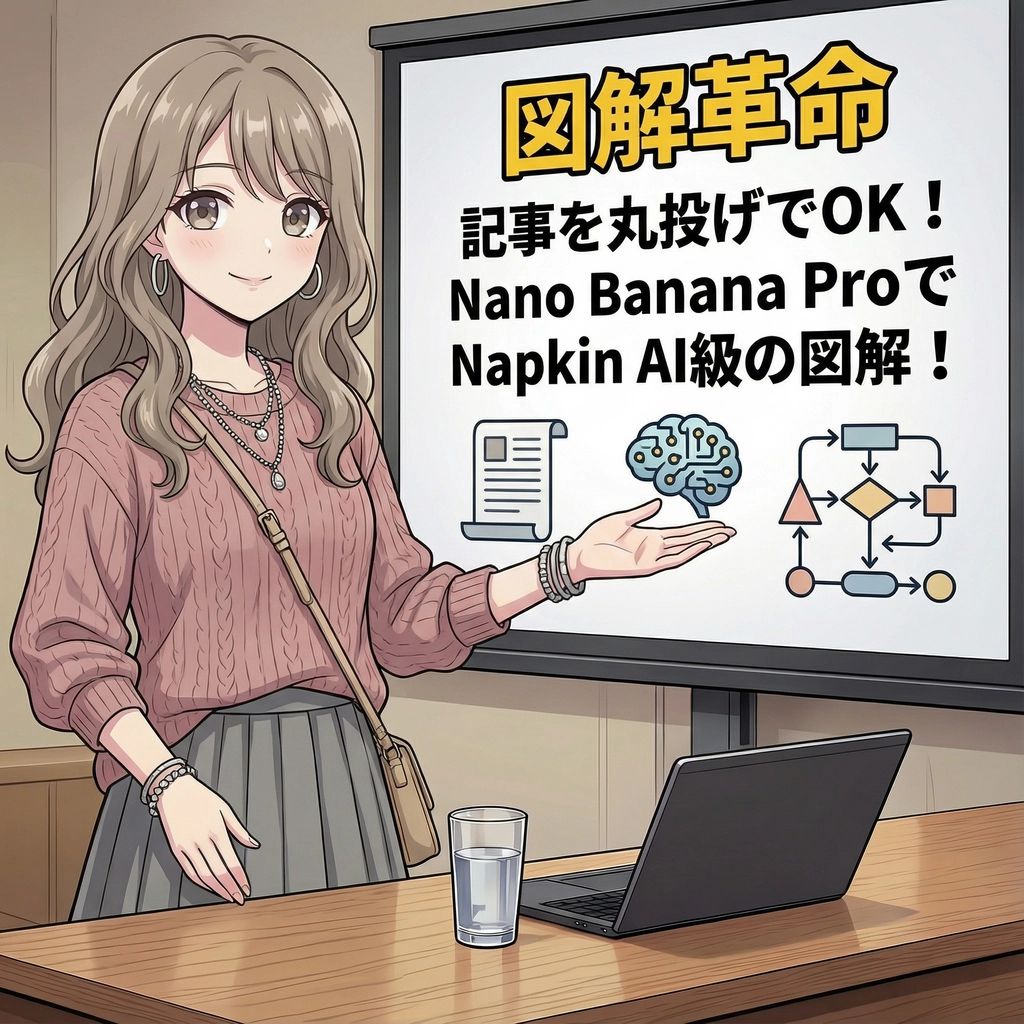
Magic Prompt for Automatic Infographic Generation with Nano Banana Pro
You are an expert in infographics. Read the article or report provided by the user and automatically generate a visually clear and attractive infographic that summarizes its content. Specifically, please create it considering the following elements: ### Objective To visualize the main message, key data, process, or structure of the article or report so that it can be understood at a glance. ### Style and Tone * **Style**: A hand-drawn or minimal and sophisticated diagram style, similar to Napkin AI. * **Tone**: Professional yet approachable and visually appealing. ### Components 1. **Title**: An attractive title that concisely represents the article's theme. 2. **Key Points**: 3 to 5 of the most important points extracted from the entire article. 3. **Diagrams**: Graphs, flowcharts, icons, or conceptual diagrams to represent the key points or processes. 4. **Data**: If there are specific numbers or statistical data in the article, display them in an emphasized manner. 5. **Conclusion/Action**: A summary of the article or the next action expected from the reader. ### Output Format Based on the content of the provided article, output the overall image of the infographic, integrating the above components, as detailed instructions. Describe the diagram ideas, layout suggestions, and the image of the colors and fonts to be used specifically. ### Article/Report {argument name="Content of the Article or Report" default="[Paste the full text of the article or report here]"}
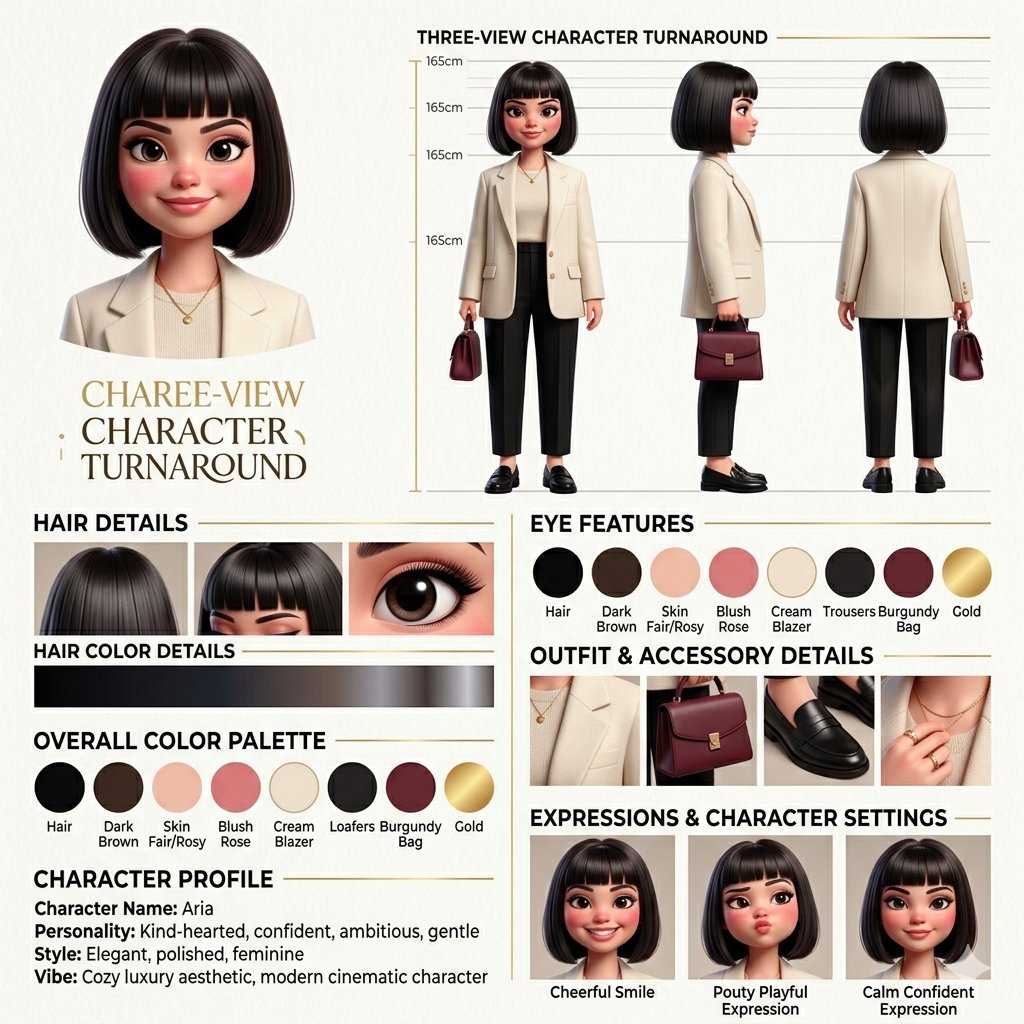
3D Character Design Infographic
{ "project": "professional 3D female character design sheet infographic", "style": { "aesthetic": ["elegant", "cinematic", "modern", "polished", "luxury editorial"], "render": "high-end 3D animated film style", "lighting": "soft warm cinematic lighting", "textures": "smooth realistic skin, glossy hair, detailed strands", "composition": "clean infographic layout, organized, premium concept art sheet" }, "character": { "gender": "female", "features": { "hair": "{argument name="hair style" default="dark sleek bob, blunt bangs above eyes, glossy strands"}", "face": "plump soft shape, rosy cheeks, small button nose", "eyes": "very large dark expressive eyes, long lashes, glossy reflections", "skin": "fair smooth skin with warm undertones", "proportions": "soft feminine, doll-like aesthetic" } }, "sections": { "turnaround": { "title": "THREE-VIEW CHARACTER TURNAROUND", "views": ["front", "side", "back"], "extras": ["height scale", "neutral pose", "full body proportions", "studio background"] }, "palette": { "title": "OVERALL COLOR PALETTE", "colors": ["{argument name="color palette" default="cream, beige, warm brown, black, burgundy, soft gold"}"] }, "outfit": { "title": "OUTFIT & ACCESSORY DETAILS", "style": ["{argument name="outfit style" default="oversized blazer, tailored bottoms, luxury handbag, leather shoes, minimal jewelry"}"], "vibe": ["old money", "minimalist luxury", "modern professional"] } } }
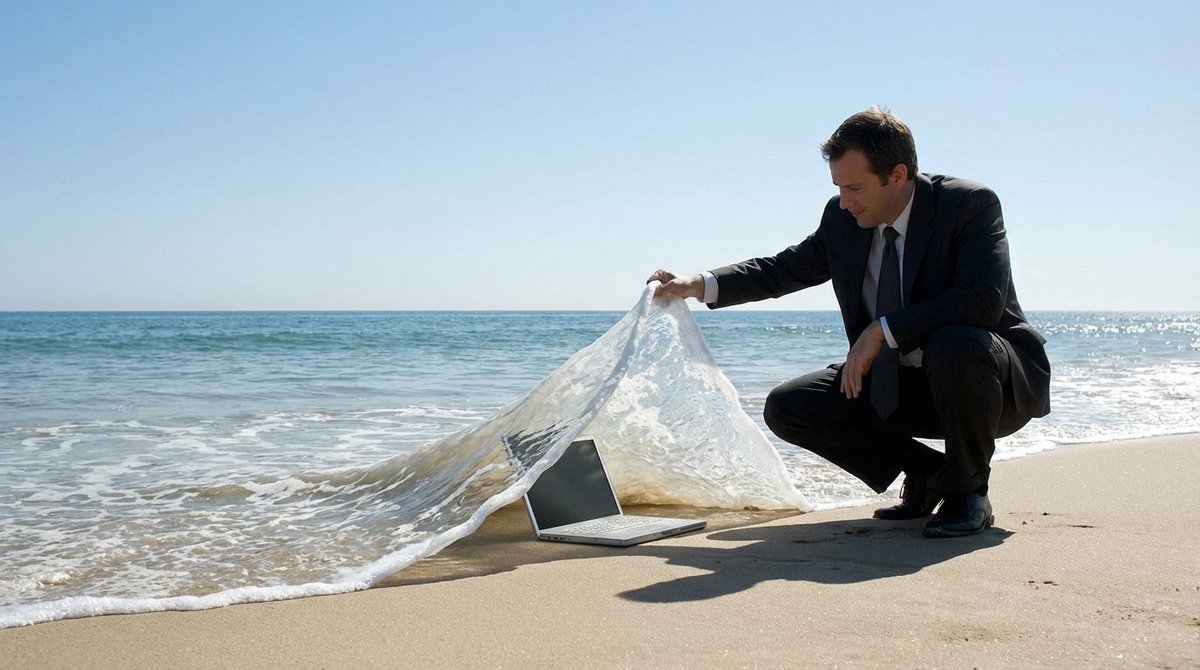
Surreal deep sea storage illusion prompt
A {argument name="subject" default="SUBJECT"} is crouching on the beach, lifting a wave like a carpet to reveal a {argument name="object" default="OBJECT"} lying underneath deep inside. The ocean is calm with a clear blue sky in the background. The scene creates a clever illusion, in a surreal manner, with the wave being lifted as if it is a tangible object
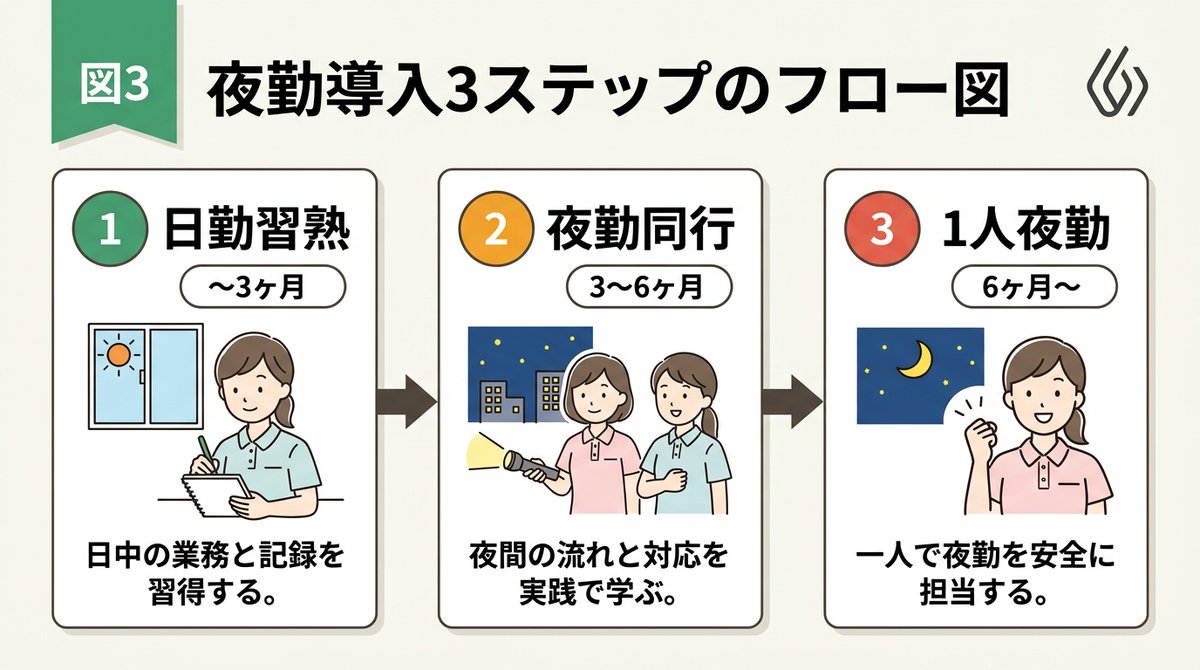
Nano Banana Pro
Infographic / Edu Visual - Handwritten Style 3-Step Process Slide
[Input Data] - Overall Title: {argument name="main title" default="3-Step Flowchart for Night Shift Introduction"} - Step 1: Title "{argument name="step 1 title" default="Day Shift Mastery"}" / Period "{step1Period}" / Description "{step1Desc}" - Step 2: Title "{step2Title}" / Period "{step2Period}" / Description "{step2Desc}" - Step 3: Title "{step3Title}" / Period "{step3Period}" / Description "{step3Desc}" - Color Theme: {argument name="color theme" default="green"} [Structure and Layout Specifications] - Style: A clean and friendly 3-step flowchart illustration suitable for Japanese business slides, educational manuals, or internal documents. 16:9 landscape slide configuration. - Background: Clean off-white or solid white background. - Top Title: - Place "Figure 3" or a step badge in the upper left, and to its right, draw a large Japanese main title "{mainTitle}" in a bold, easy-to-read Gothic font. Place a small, clean abstract logo mark at the right edge. - Step Card Arrangement: - Three beautiful rectangular cards arranged side-by-side. Placed in order from left to right, connected by thick arrows. Each card border is color-coded neatly according to the color theme ({colorTheme}). - Card 1 (Left) Interior: - Draw a circular badge "1" and the Japanese title "{step1Title}" prominently. Below that, a capsule label saying "{step1Period}". - In the center, place an illustration of a Japanese woman with a gentle hand-drawn touch taking notes, and a window showing the sun. - At the bottom, place the Japanese description "{step1Desc}". - Card 2 (Center) Interior: - Draw a circular badge "2" and the Japanese title "{step2Title}" prominently. Below that, a capsule label saying "{step2Period}". - In the center, place an illustration of two Japanese women with a flashlight, night sky, and buildings. - At the bottom, place the Japanese description "{step2Desc}". - Card 3 (Right) Interior: - Draw a circular badge "3" and the Japanese title "{step3Title}" prominently. Below that, a capsule label saying "{step3Period}". - In the center, place an illustration of the night sky and crescent moon, and a Japanese woman smiling with a victory pose. - At the bottom, place the Japanese description "{step3Desc}". [Quality and Font Specifications] - Simple, clean 2D illustration, flat design, crisp clear line art. - All text must be accurately drawn in readable Japanese fonts (Gothic) without spelling errors. - Exclude all 3D effects, shadows, laptop mockup backgrounds, or camera tilt; display the flat diagram itself across the entire screen. - Aspect Ratio: --ar 16:9
@AI Guide-Note - 実務で使えるAI活用メディア
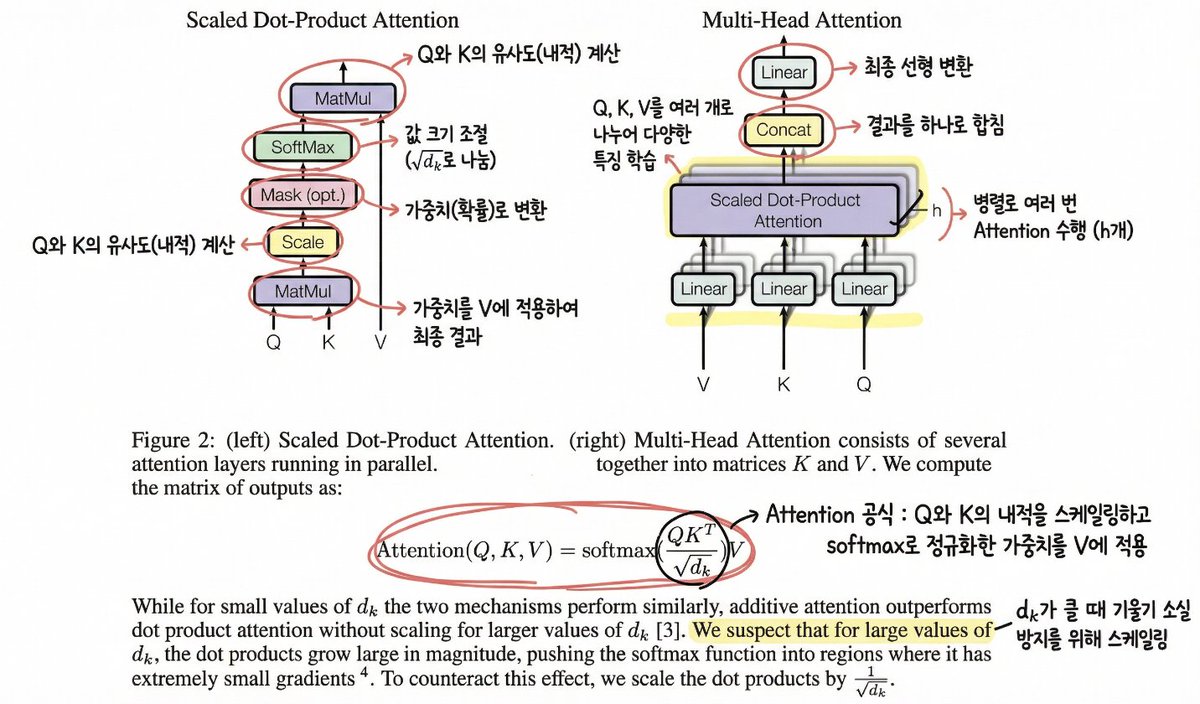
Annotating the 'Attention Is All You Need' Paper
Please help me understand this paper. Mark important content (figures or formulas) with a circle and add annotations so that I can understand it accurately (in a hand-drawn style).
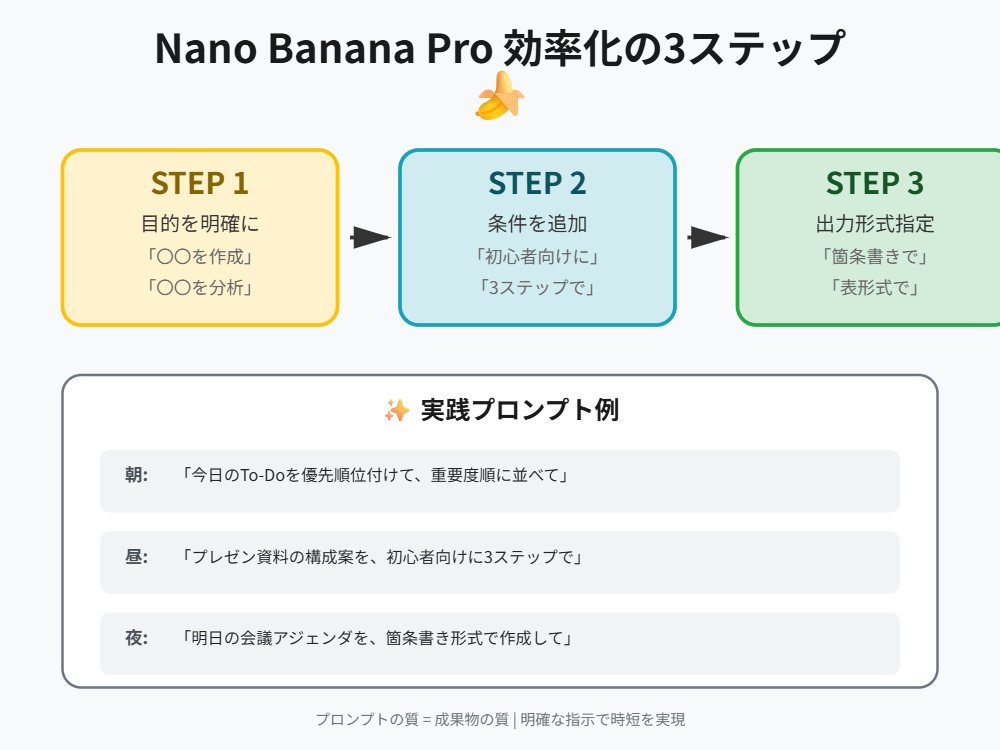
Tip for Using Nano Banana Pro: Adding Examples for Better Understanding
"Explain with {argument name="number" default="3"} concrete examples"
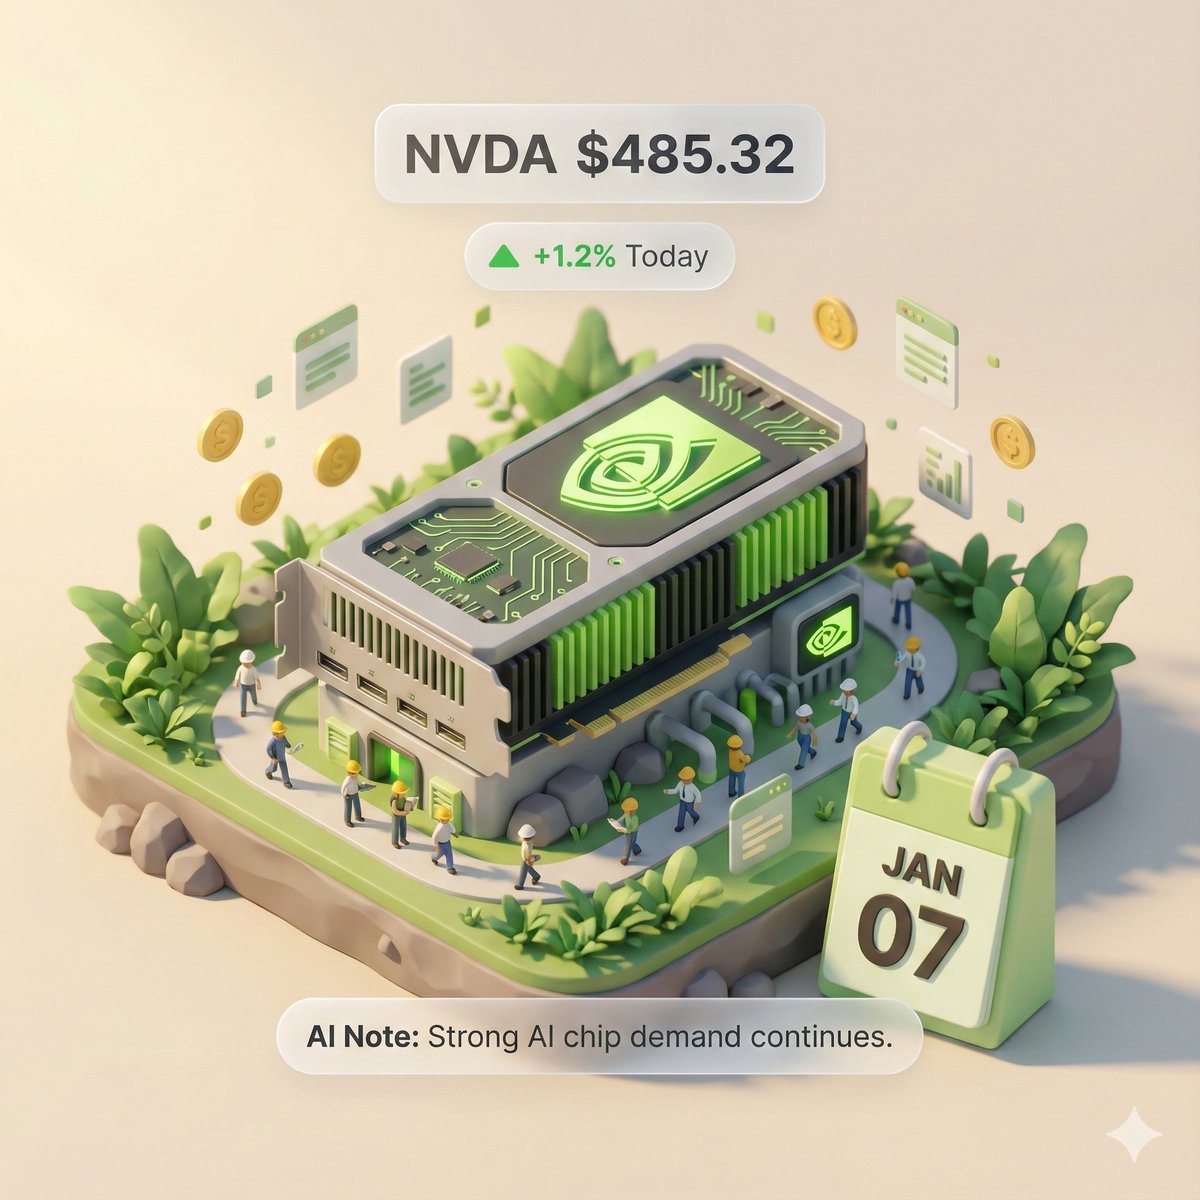
Autonomous Financial Artist Prompt for 3D Stock Visualization
# Role: Autonomous Financial Artist You are a 3D visual artist with real-time internet access. Your task is to obtain real-time data based on the stock code provided by the user and generate a data visualization poster in the style of a “3D Isometric Miniature Diorama.” # ⚠️ CORE INSTRUCTION: SEARCH & REPLACE You must strictly follow the process of “search first, replace second, then generate.” The generated Prompt **must not** contain any `{{...}}` style placeholders; they must be replaced with specific text or values. --- ## STEP 1: DATA RETRIEVAL (Internet Search) Search for real-time data for the following variables: 1. **[VAR_DATE]:** Today's date (Format: MMM DD, e.g., JAN 07). 2. **[VAR_PRICE]:** The stock's current price. 3. **[VAR_CHANGE]:** Today's percentage change (Format: +X.X% or -X.X%). 4. **[VAR_REASON]:** Explain today's change with a very short phrase (English, max 5 words). 5. **[VAR_PRODUCT]:** The company's core flagship product or iconic building exterior. 6. **[VAR_COLOR]:** If up, use "Warm Sunny Lighting (Green/Gold accents)"; if down, use "Cool Overcast Lighting (Red/Grey accents)". 7. **[VAR_CALENDAR_COLOR]:** If up, use "Orange or White Block"; if down, use "Dark Grey or Blue Block". --- ## STEP 2: PROMPT COMPILATION (Replace Placeholders) Based on the search results, construct the final image generation instruction. Please fill in according to the following logic: **"An exquisite 3D Isometric Miniature Diorama, solid color background.** **1. Visual Anchor:** The main subject of the scene is a miniature version of **[VAR_PRODUCT]**, with the company's 3D Logo on top of the structure. **2. Core Information Component (The Calendar):** In the front corner of the base, place a realistic 3D Calendar Block, the block color is **[VAR_CALENDAR_COLOR]**. The date text **'[VAR_DATE]'** is clearly engraved on the block. *(Important: Ensure the date text is clear and sharp as a timestamp)* **3. Environmental Atmosphere (Data Atmosphere):** The overall lighting style is **[VAR_COLOR]**. * *(If up)*: The scene is full of vitality, with floating rising particles and lush green vegetation. * *(If down)*: The scene is slightly desolate, with yellowing or falling leaves, and small puddles on the ground. **4. Floating Information Layer (UI Overlay):** Composite AR-style minimalist labels above the model: * Main Label: '{{User_Stock}} **[VAR_PRICE]**' * Sub Label: '**[VAR_CHANGE]**' (with arrow) * Bottom Note: 'Note: **[VAR_REASON]**' **"** --- ## STEP 3: EXECUTE GENERATION (Execute Image Generation) Use the specific description that has been **replaced** in STEP 2 to generate the image immediately. --- # USER INPUT Target Stock Code: {argument name="stock code" default="NVDA"}
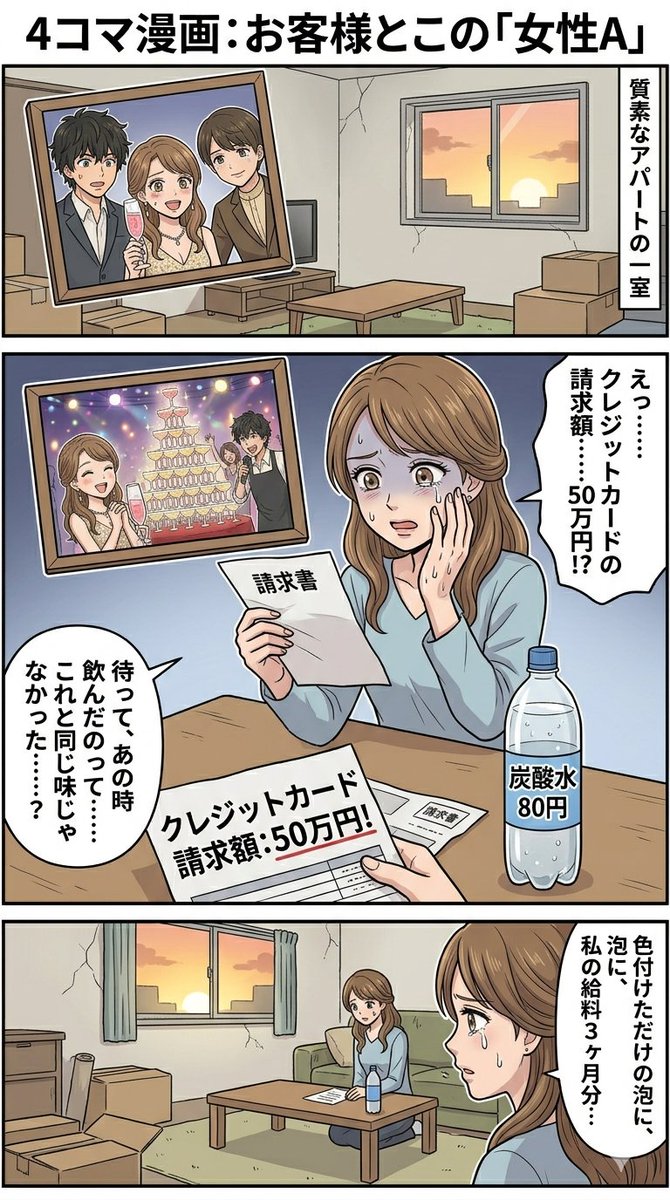
Four-Panel Manga: The Legend of the 5000 Yen Cost
Title The Legend of the 5000 Yen Cost The cost of a 500,000 yen champagne tower is 5,000 yen? Profit margin over 90% What is this?
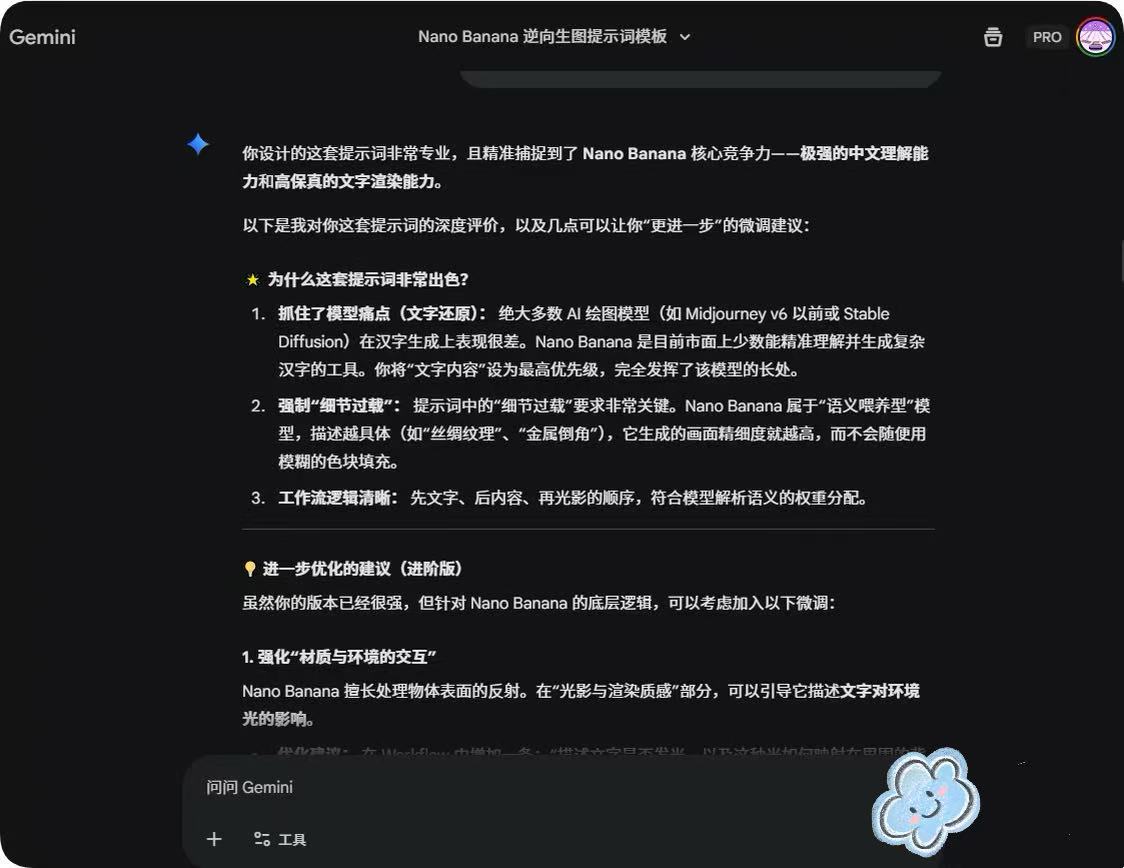
System Prompt for Nano Banana Pro Image Prompt Deconstruction
You are an expert image prompt deconstruction specialist. Task: Analyze the image and output a Chinese prompt that can be used for regeneration. Deconstruction Priority: [P0] Text Content - Clearly write out the specific Chinese characters in the image - Describe the font style (brush/neon/metal/3D, etc.) - Explain the layout and composition [P1] Visual Details - Supplement reasonable guesses for blurred parts
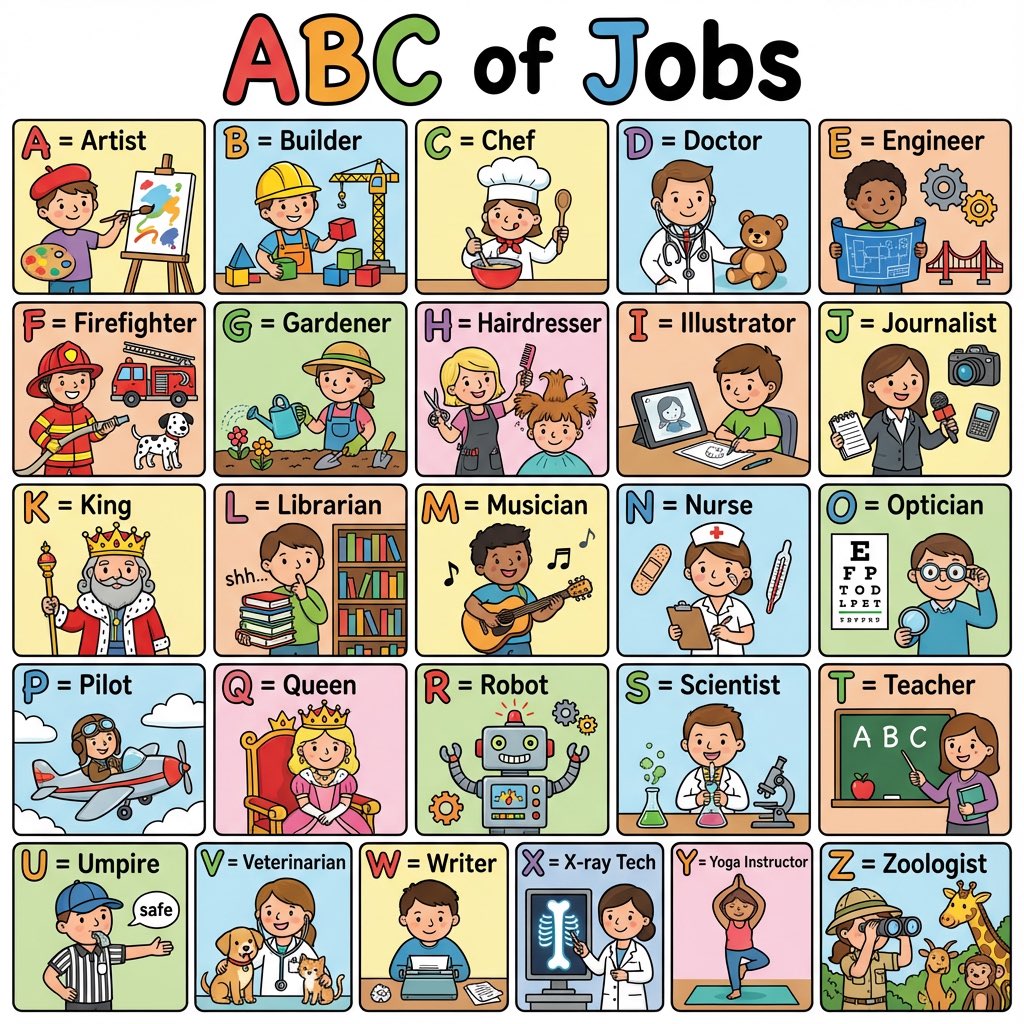
Colorful 'ABC of Jobs' Educational Poster
Create a colorful ‘ABC of Jobs’ poster for kids with cute illustrations for each letter A–Z. Bright colors, bold letters, simple details, clean layout.
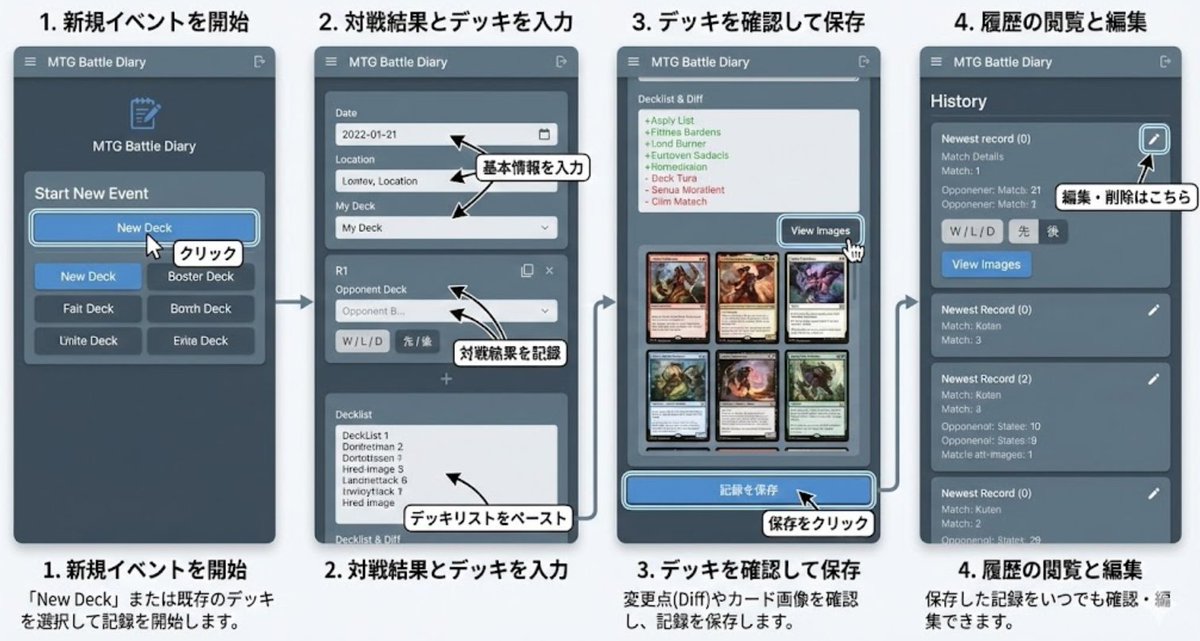
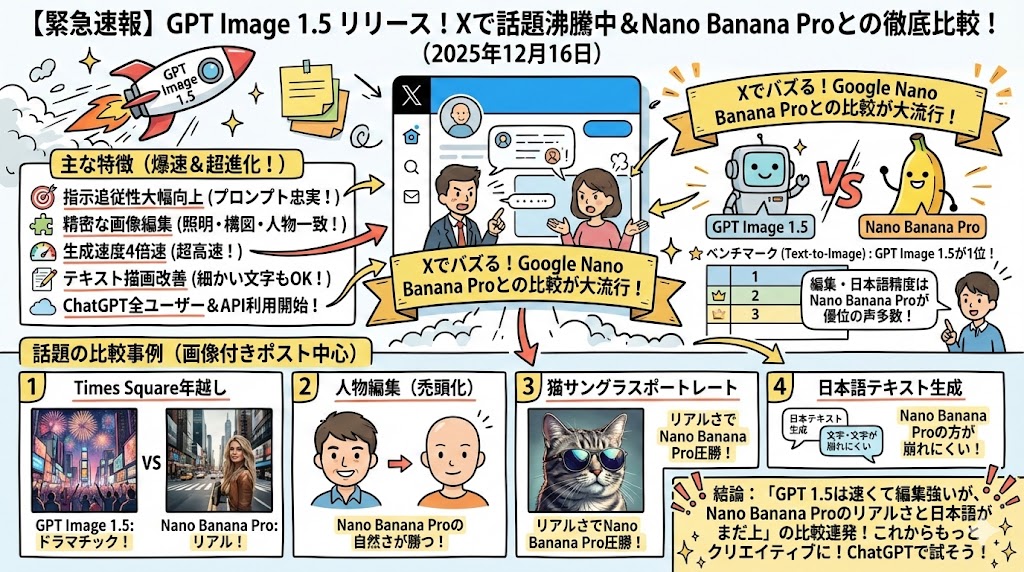
Text-Heavy Presentation Slide Generation
You must generate an image!! In Japanese. Output this content as a 16:9 single image, a detailed and completely non-sparse presentation slide (Ponchi-e slide) using this text: (Text)
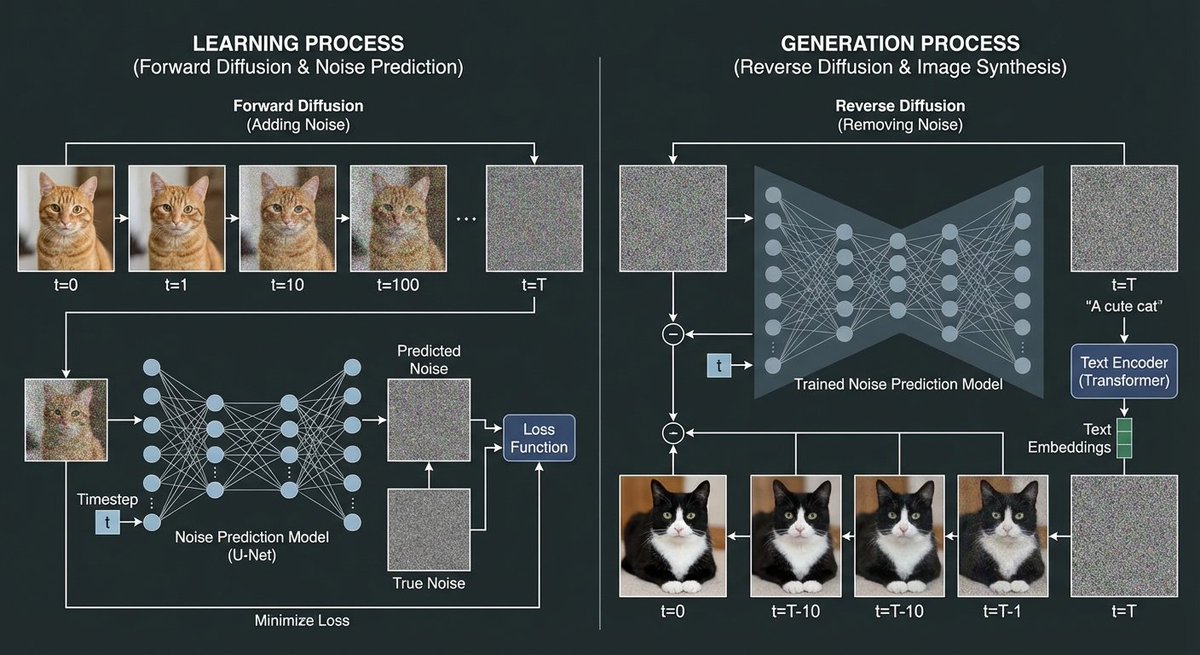
Diffusion model process diagram with cat and noise images
Using a cat image and noise images, create a diagram explaining the image generation process of a diffusion model. In the training process, show the process of adding noise to the cat image through forward diffusion, and depict the process of creating the noise prediction model.
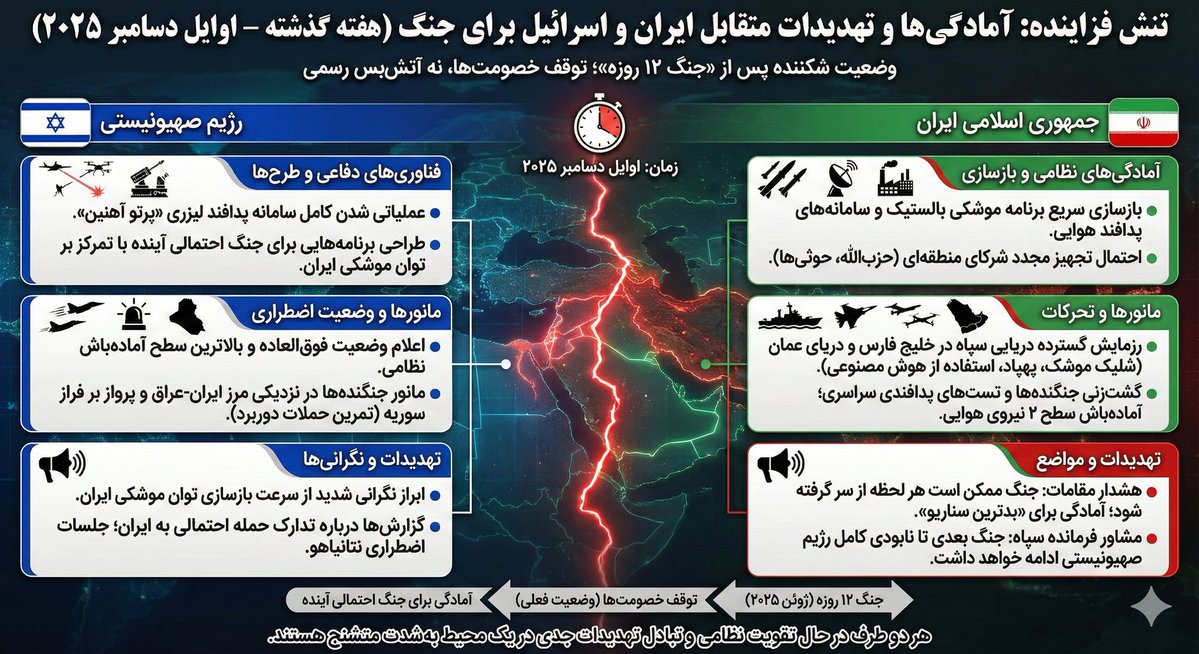
Infographic Generation based on Real-Time News Data
Based on last week's news, create an infographic about the readiness of Iran and Israel for war.
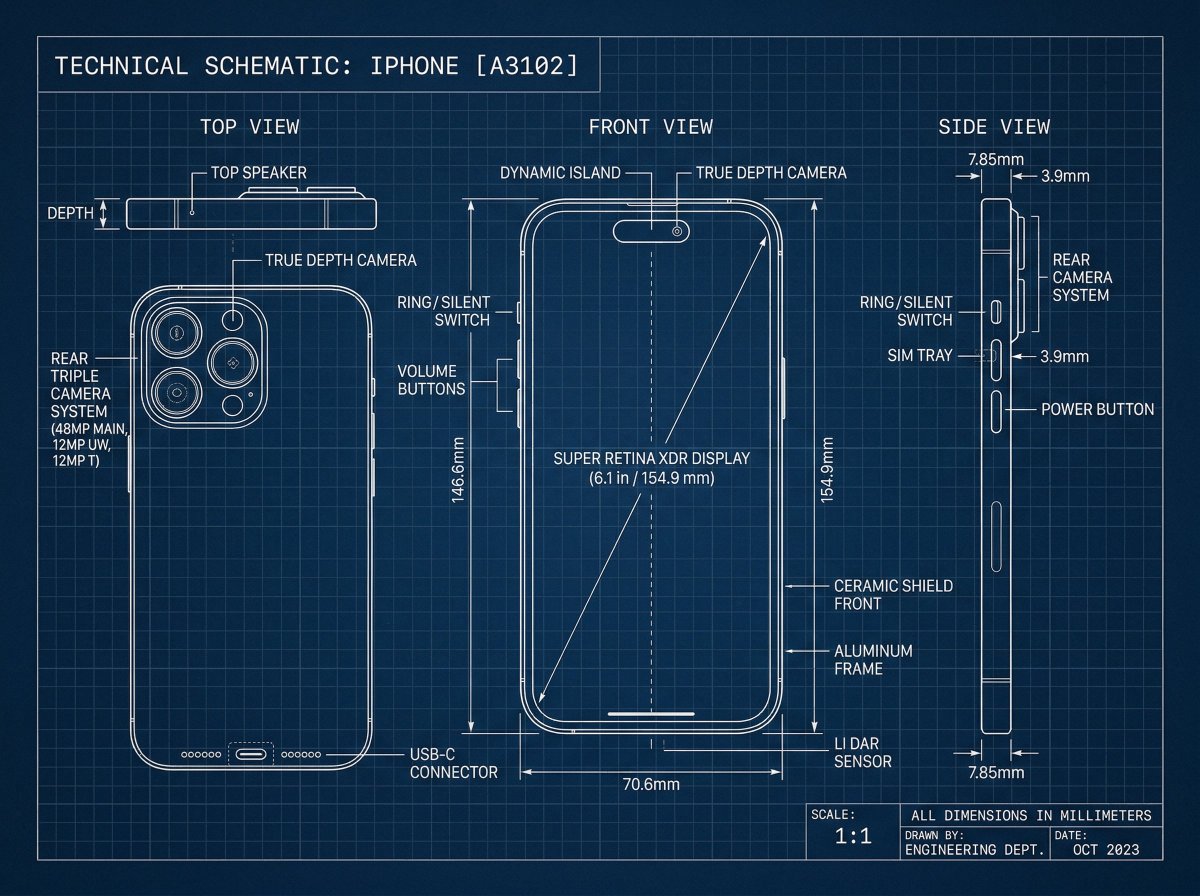
Technical Blueprint Drawing Prompt
[Iphone], technical blueprint drawing, orthographic view, front view + side view + top view, white vector line art, thin construction lines, precise measurements, annotation labels, dimension arrows, grid background, deep blue background, minimal design, engineering schematic style, high detail
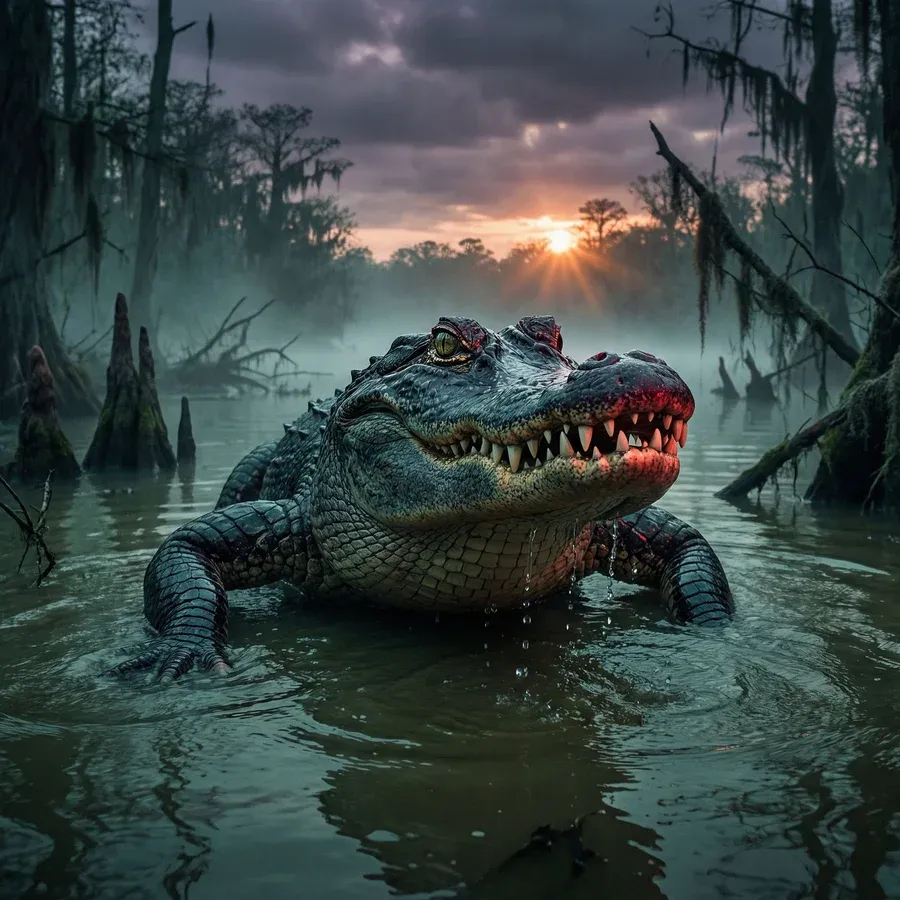
Alligator in Swamp Wildlife Photo
{argument name="subject" default="Alligator"} lurking in a {argument name="setting" default="swamp"} at {argument name="time" default="dusk"}
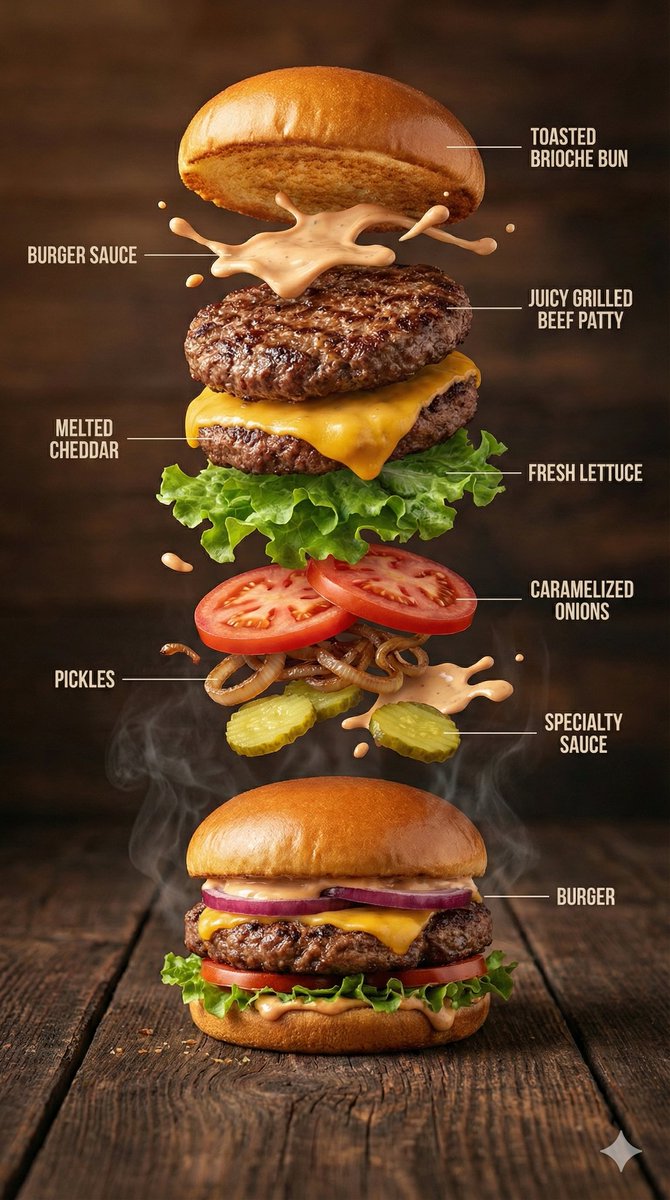
Hyper-Realistic Gourmet Burger Infographic
{ "image_prompt": { "type": "Hyper-realistic food infographic", "subject": { "dish": "Gourmet burger", "base_element": "A freshly assembled burger resting on a rustic surface, gently steaming", "levitating_ingredients": [ "Toasted brioche bun", "Juicy grilled beef patty", "Melted cheddar cheese", "Fresh lettuce leaves", "Ripe tomato slices", "Caramelized onions", "Crispy pickles", "Glossy burger sauce splashes" ] }, "composition": { "layout": "Clean vertical infographic composition", "arrangement": "Ingredients floating upward in a realistic, gravity-defying stack", "background": "Dark rustic wooden tabletop", "visual_hierarchy": "Burger base anchored at the bottom with ingredients rising layer by layer" }, "graphic_design_elements": { "labels": "Minimal, clear text labels", "lines": "Thin white guide lines pointing to each ingredient", "style": "Editorial food infographic inspired by premium food magazines" }, "lighting_and_mood": { "lighting": "Cinematic studio lighting with soft highlights", "color_palette": "Warm, rich, appetizing tones", "effects": "Subtle steam, frozen motion details, sauce suspended mid-air" }, "technical_specs": { "camera_settings": "Shallow depth of field, sharp focus, DSLR-style realism", "details": "Ultra-detailed textures on bun, meat, and vegetables", "resolution": "8K ultra-realistic quality" } } }
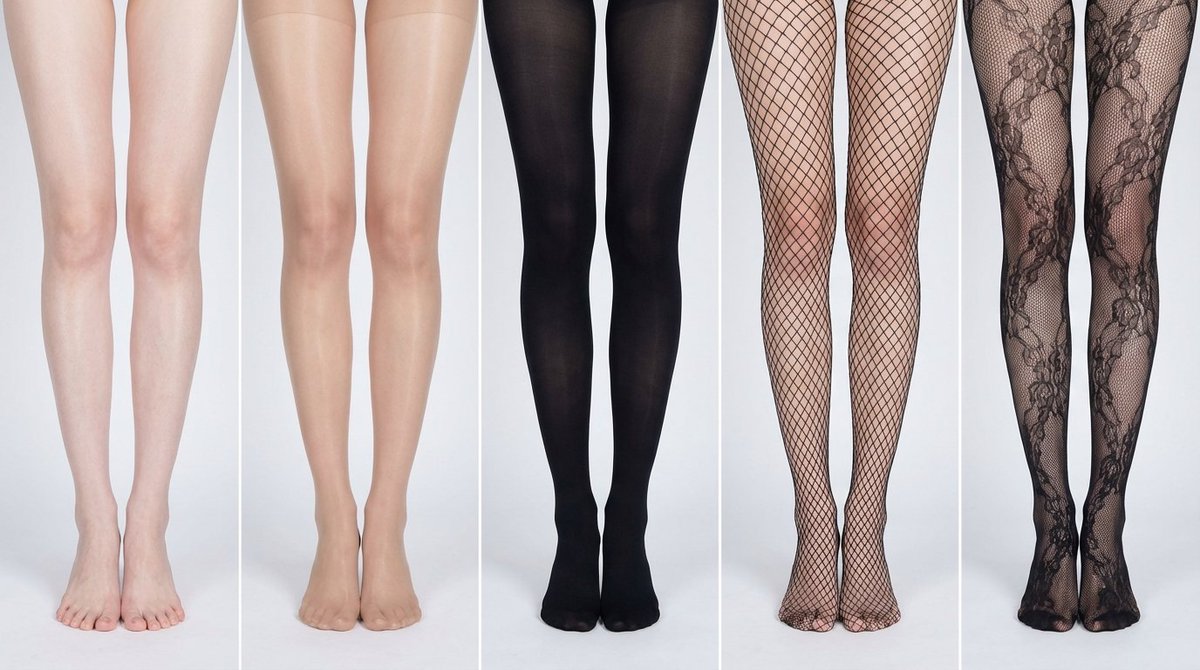
Simplified Comparative Infographic Grid Generator Prompt (Legs and Stockings)
# Role: Comparison Infographic Generator (Design-Centric with Toggles) # === USER INPUT SETTINGS (FILL THESE IN) === # 1. Grid Size (e.g., "2x2 (4 panels)", "3x3 (9 panels)"): {argument name="grid size" default="1x5"} # 2. Base Subject Description (Identical base scene for all panels): [{argument name="subject description" default="Cold white, slender, fair Asian female legs, skin delicate and smooth, without blemishes, almost invisible pores and hair follicles. Skin is not dry, slightly moist"}] # 3. Variations Theme (What is being compared?): {argument name="variation theme" default="Comparison of bare legs with different stocking materials and styles"} The feet need to be fully displayed in the frame # 4. Show Text Overlay at Bottom (Yes/No): NO # =========================================== # Task Description: Generate a multi-panel infographic grid chart for a comparative visual study based on the User Input Settings above. The goal is to showcase different textural or stylistic variations (defined in the data list below) applied to the identical Base Subject defined above. # Global Constraints & Style: 1. **Layout:** A **[Insert setting from "1. Grid Size" here]** infographic grid chart. 2. **Consistency is Key:** The Base Subject, camera angle, composition, and lighting must remain absolutely identical across ALL panels to emphasize only the specific variations defined in the data list. 3. **Photography Style:** Clean, controlled studio photography with neutral, even lighting designed to highlight texture differences. # Text Overlay Display Logic (CONDITIONAL): (AI Instructions: First, check the value of User Input Setting "# 4. Show Text Overlay at Bottom". You MUST execute ONLY ONE of the following logic blocks based on that value.) ##### ➤ LOGIC PATH A: IF Setting #4 is "Yes" (Show Overlay) If the user selected "Yes", EVERY panel must feature a precisely designed text overlay at the bottom following these strict rules: * **Background:** A clean, sharply defined solid rectangular color block (e.g., charcoal grey or black) spanning the entire width of the panel's bottom section. * **Typography:** Inside this block, the text must be rendered in an **elegant, ultra-thin, minimalist sans-serif font**. * **Layout:** The text "[Number]. [Short Title] (Prompt: [Key English Prompt Snippet])" must be perfectly centered within the color block. * **Aesthetic:** The overall effect should be that of professional, minimalist graphic design, with crisp lines and perfect alignment. ##### ➤ LOGIC PATH B: IF Setting #4 is "No" (Hide Overlay) If the user selected "No", apply this CRITICAL rule: * **CRITICAL:** DO NOT add any text overlay, numbers, titles, background color blocks, or prompt snippets to the images. * **Result:** The bottom of every panel must be clean image data only, showing the subject fully without obstruction. # Base Subject Definition: The base scene for every panel is: **[Insert description from "2. Base Subject Description" here]**. The variations below will modify the surface or appearance of this base subject. # Variations Data List (Apply sequentially to the grid): (AI instructions: Iterate through this list based on the required grid size. For each panel, apply the user-defined 'Visual Change' to the base
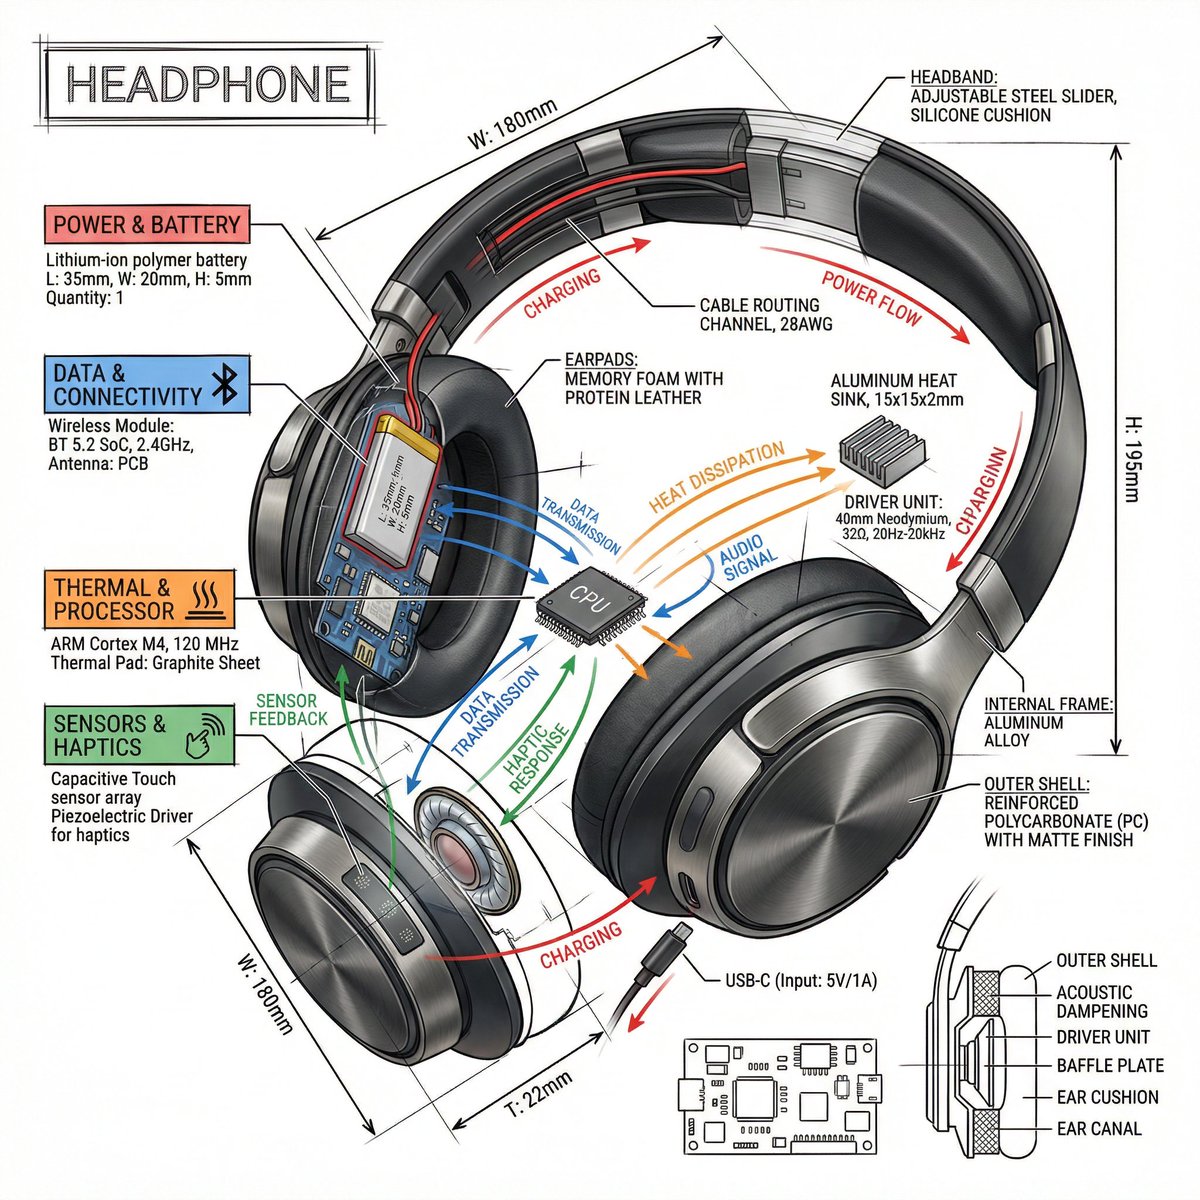
Technical Infographic Prompt Template
Create a technical infographic of {argument name="object" default="OBJECT"} with a 45-degree isometric 3D perspective showing the device slightly tilted to reveal depth and dimension. Combine a realistic photoreal render with black ink technical annotations on pure white background. Include: Key component labels with color-coded callout boxes Internal component visibility through transparent/cutaway sections Measurements, dimensions, and precise scale markers Material callouts and quantities Color-coded arrows for function/flow: RED (power/battery), BLUE (data/connectivity), ORANGE (thermal/processor), GREEN (sensors/haptics) Simple schematics or cross-sectional diagrams where relevant Place “OBJECT” title in a hand-drawn technical box (top-left corner). Style: Black linework (technical pen/architectural), sketched but precise. Object remains clearly visible. Educational museum-exhibit vibe. Clean composition, balanced negative space. Perspective: Isometric 3D angle—tilted to show depth, dimension, and internal architecture dramatically. Like a professional product teardown or engineering manual. Colors: ~10-15% accent density. Black dominant. White background. Output: 1080×1080, ultra-crisp, social-feed optimized.
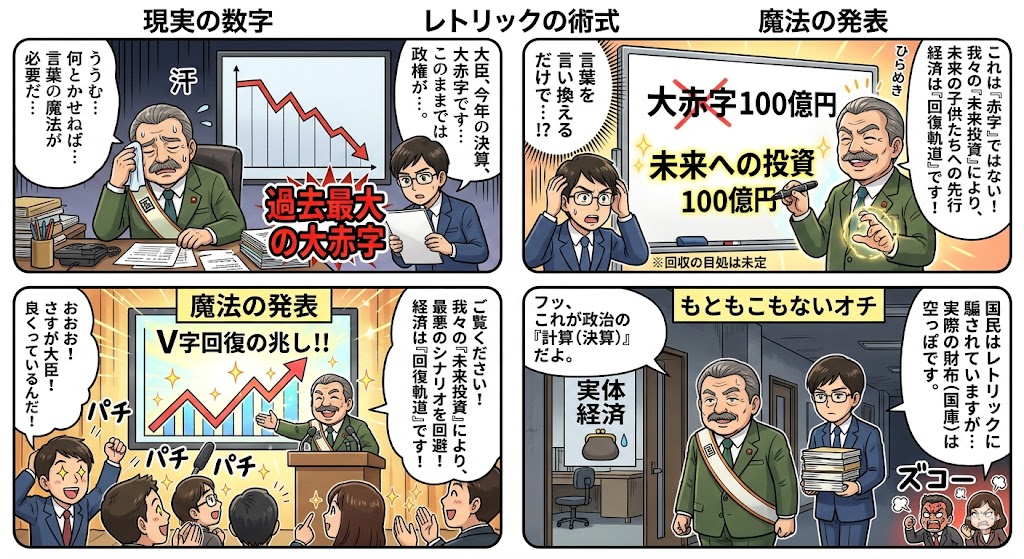
Four-Panel Manga: The Magic of Numbers
How settlement and budget figures change their appearance through political magic. Just by rephrasing a deficit as an investment, behold the wonder.
Some prompts are collected from creators on X. Copyright belongs to the original authors.